BestFunc

Redesign of Equipment Fault Monitoring System to Boost Production Efficiency
Platform
TPM Manufacturing SaaS
Time
Nov 2022 - Jan 2023
Role
UX&UI Design
Tools
Figma, Adobe Creative Suite
Team
Product Manager, Developer
Project Brief
Background
During the winter of 2022 to 2023, I worked as a UX&UI design intern at BestFunc, an AI-based SaaS startup in the manufacturing sector. As the sole designer in the company, I was responsible for designing a series of TPM SaaS products and the company's logo. The systems I worked on included equipment fault monitoring, personnel management, sound data operation, blueprint annotation, and device counter interaction interfaces. Among these, the most important project was the equipment fault monitoring system, which I will introduce in this case study.

My Impact
I redesigned the system’s core interfaces and workflows based on feedback from factory operators and maintenance engineers who trialed the MVP version. This process focused on improving usability, aligning with workflows, and addressing pain points specific to the manufacturing environment.
What is the Equipment Fault Monitoring System?
The Equipment Fault Monitoring System is part of TPM (Total Productive Maintenance) system designed to help manufacturing factories improve equipment utilization and performance.
It increases the efficiency of equipment monitoring, detects and predicts machine failures in real-time, ensures production runs smoothly, improves product yield, and reduces production costs.
Factory Deployment Environment
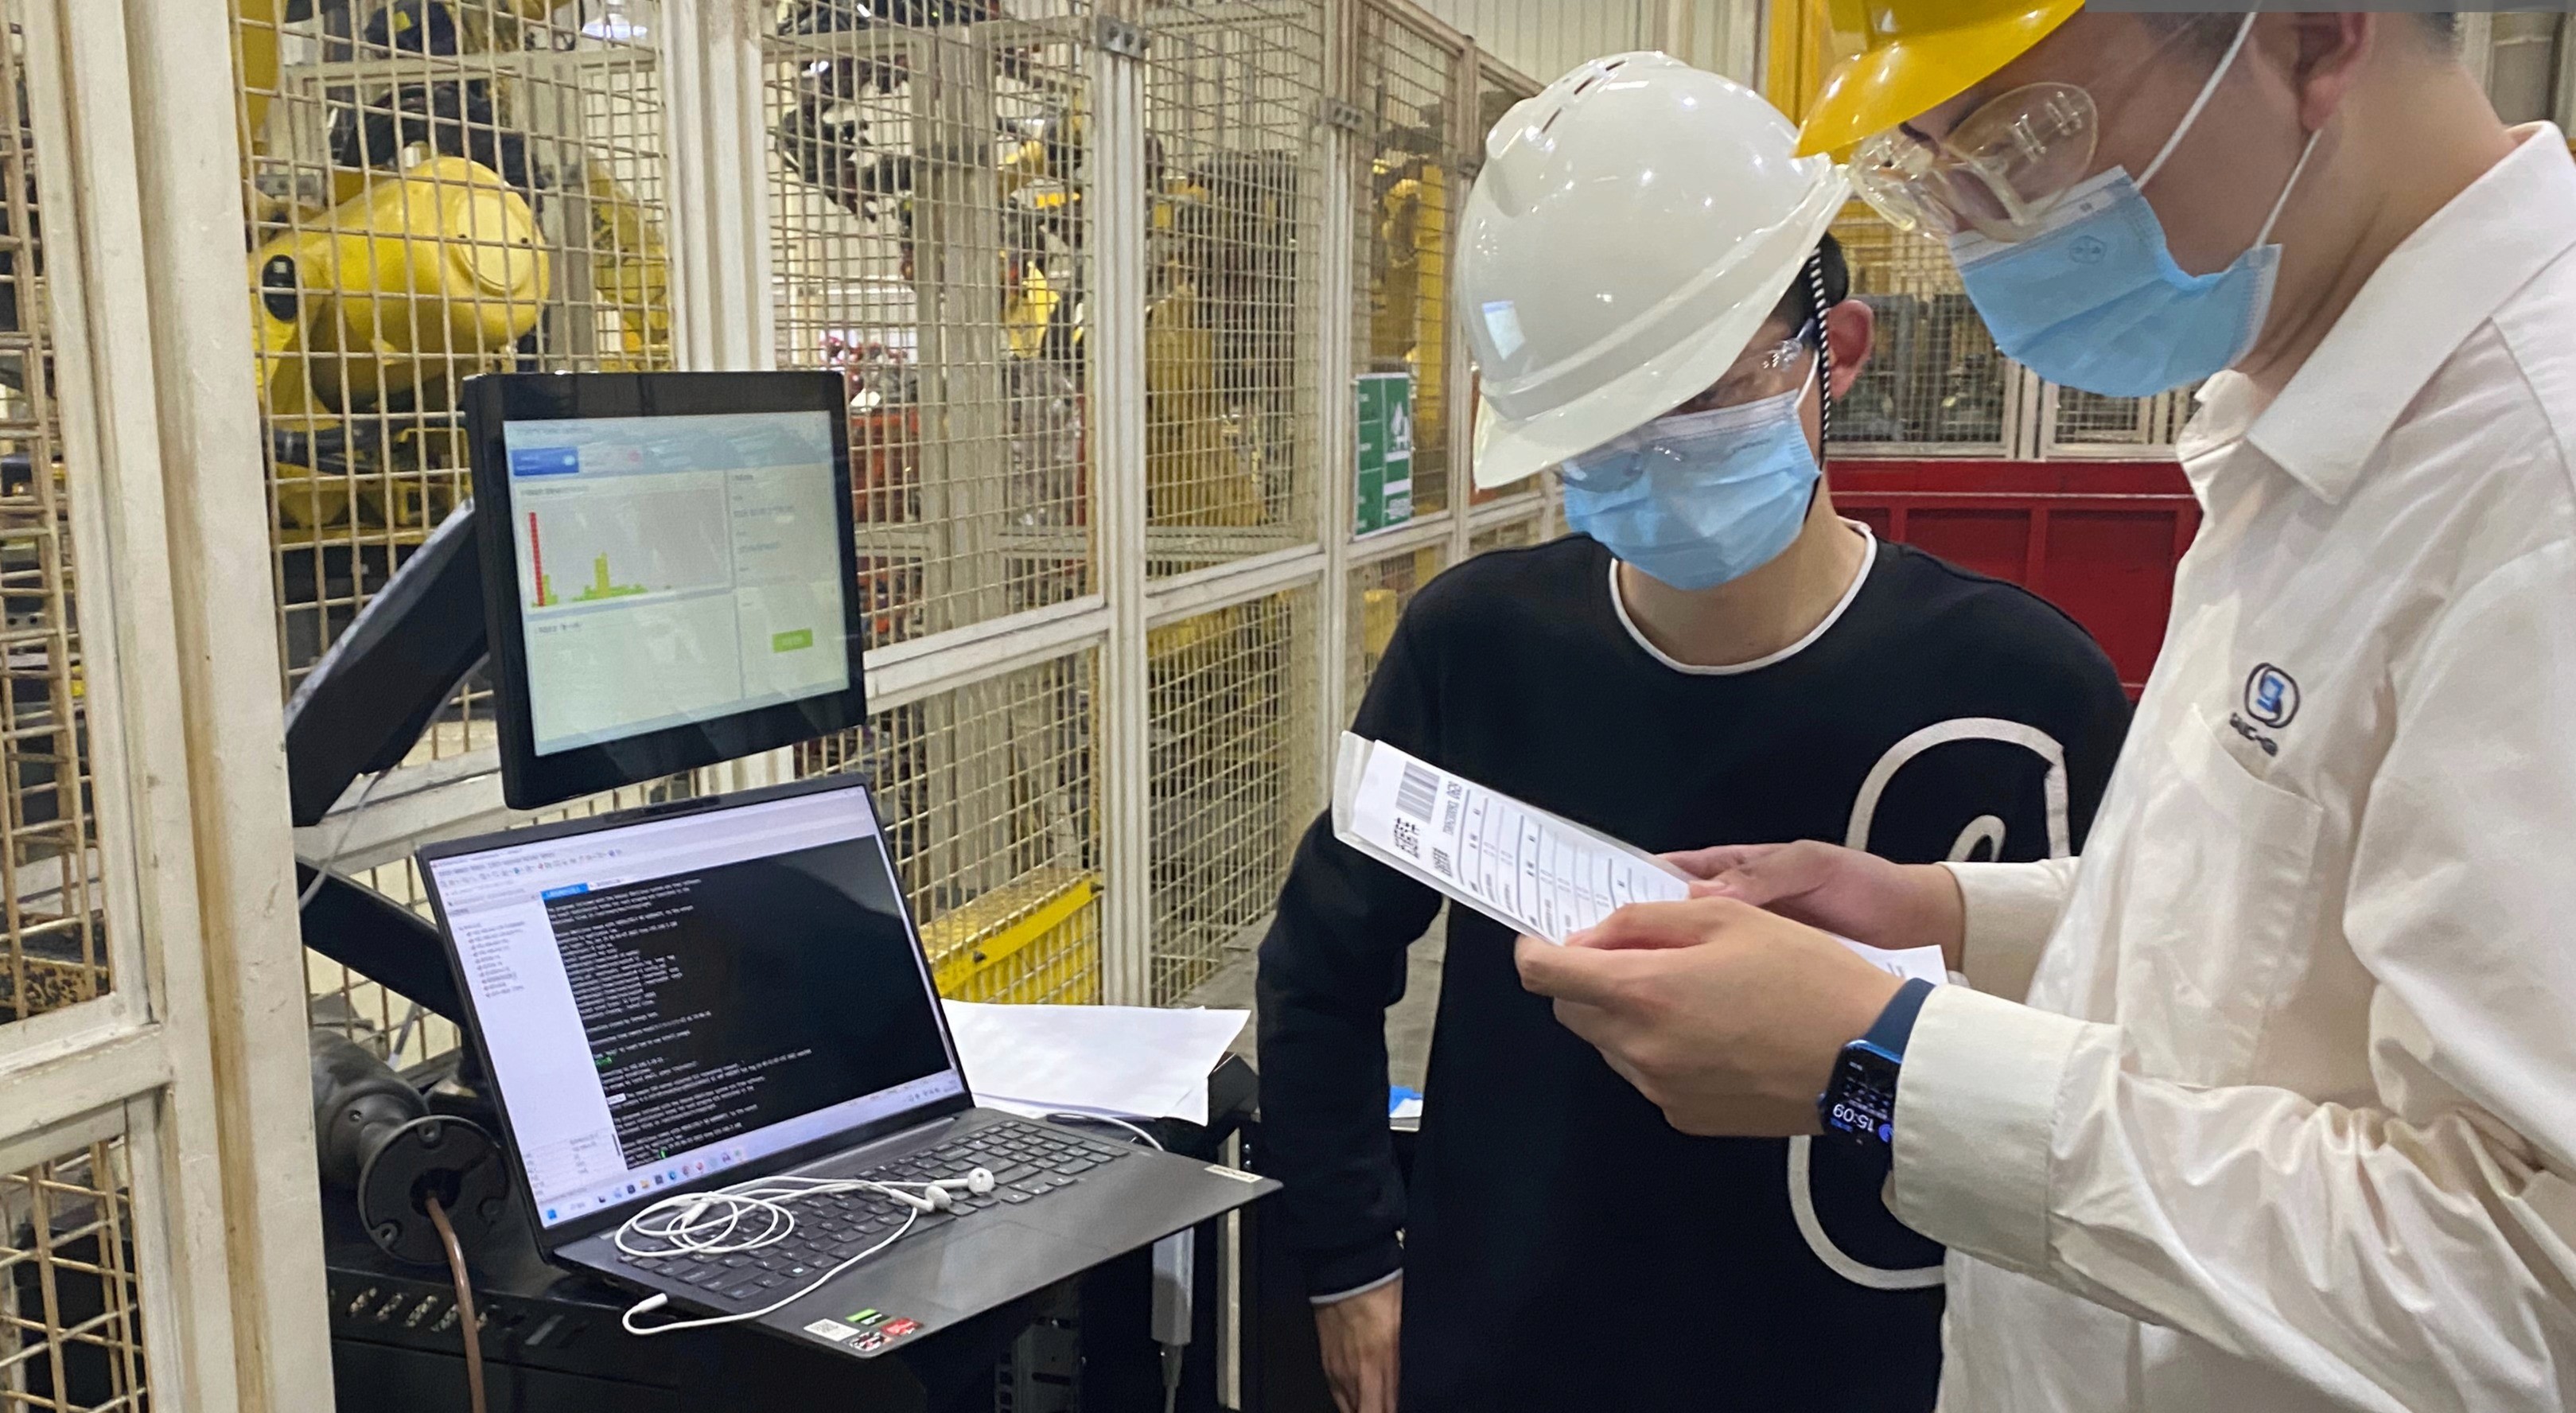
Why Do Factories Need It?
Here’s a simple example:
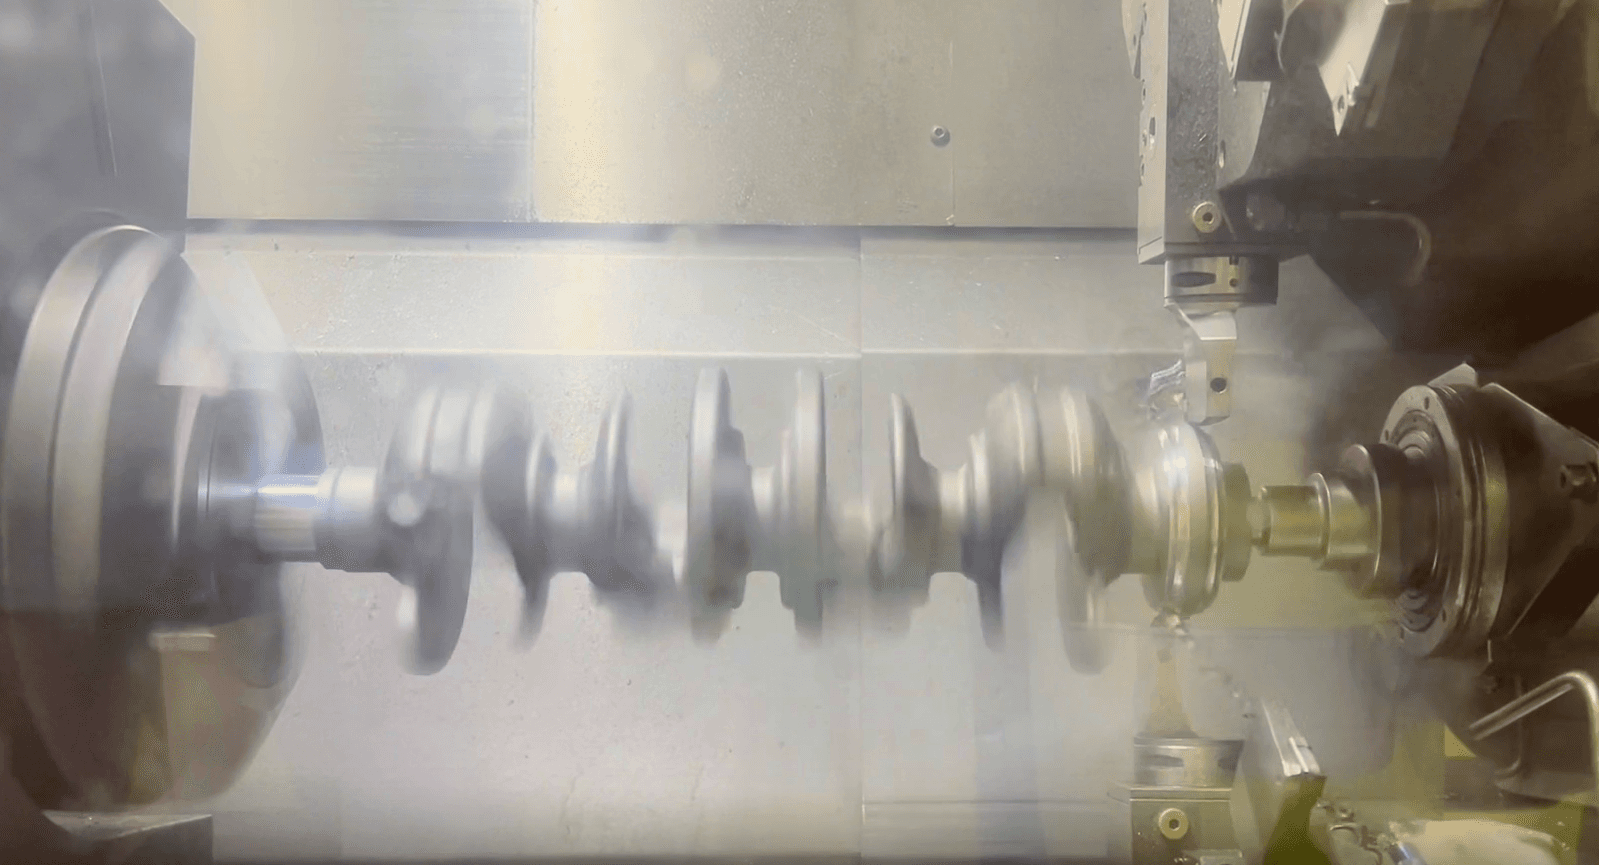
Factories consume a large number of drill bits daily due to wear and tear. Overused drill bits can produce defective parts, causing financial losses. However, detecting drill bit wear in time is challenging for humans. So what is the solution?
The answer is Sound.
BestFunc’s equipment fault monitoring system uses deep learning-based acoustic detection to monitor the sounds of drill bits during operation. Even in noisy environments, it can detect abnormal drill bits, log the data, and alert workers promptly.
Key Product Features
Integrated Hardware and Software
➡️ Sensors (sound, vibration, temperature, and current) installed on machines continuously upload real-time data to cloud servers.AI-Powered Algorithms
➡️ Machine learning models establish reference standards by analyzing existing equipment data (e.g., fault and pre-fault conditions).Real-Time Alerts
➡️ When machine enters an abnormal state, the system instantly notifies users.Predictive Maintenance Warnings
➡️ Users are alerted before equipment failures occur, enabling proactive measures.
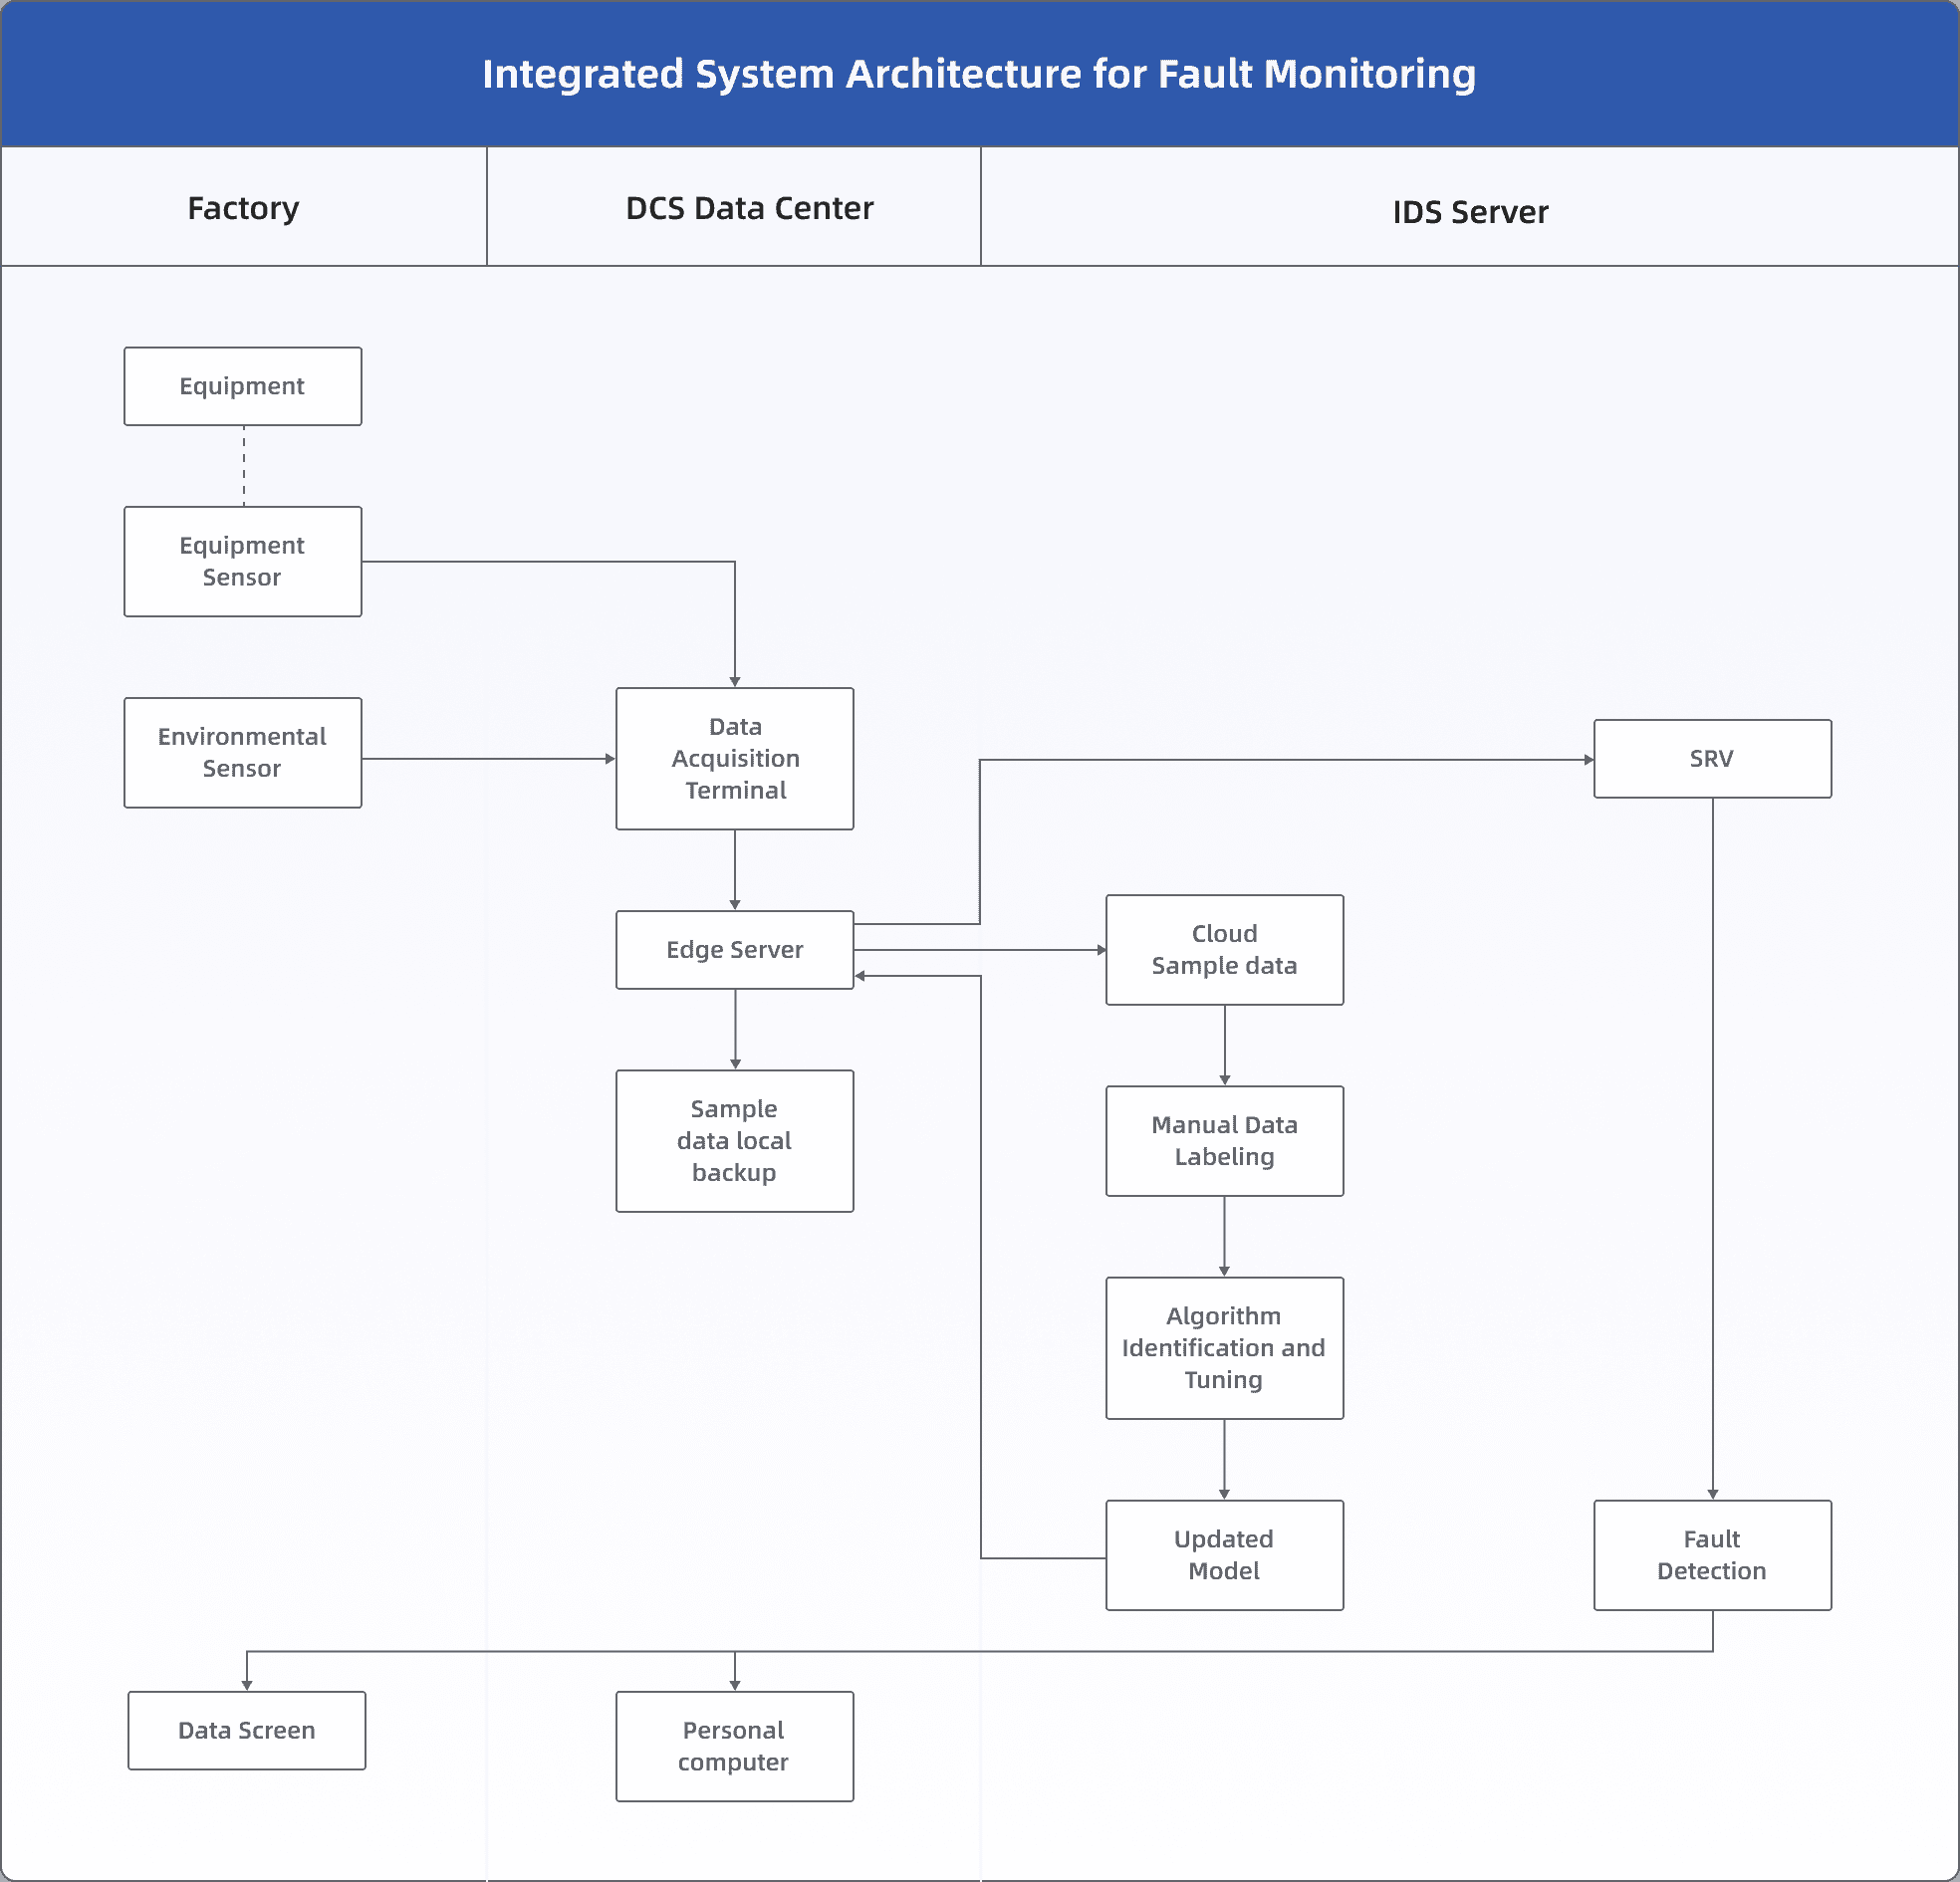
System Architecture and Workflow
This is a software and hardware integrated system that uses sensors installed at critical points in factory equipment to collect data. This data is then uploaded to cloud servers and analyzed through AI to replace human predictions of equipment health.
Design Process
▼ The following is the design process
User research
I conduct interviews and online discussions with factory operators and maintenance engineers who had used the MVP version of the system to identified pain points in this existing system.

Factory Operators
Role:
Frontline factory workers who are responsible for the daily operation and monitoring of machines.
Requirements:
Quickly understand the operational status and health of machine.
Receive alert notifications and take immediate action.
Use a simple and easy-to-navigate interface to reduce the learning curve.

Maintenance Engineers
Role:
Professionals responsible for maintaining and repairing machine to ensure long-term stable operation.
Requirements:
Diagnose machine faults and predict potential failures.
Access detailed data records (e.g., temperature, vibration data).
Optimize maintenance plans through the analysis of historical data.
User Journey Map
The Equipment fault monitoring system user journey is divided into three stages: pre-monitoring, during monitoring, and post-monitoring. Based on the key pain points at each stage, specific optimization directions are identified to address experience issues.
Stage 1: Pre-monitoring
Stage 2: During Monitoring

Stage 3: Post-Monitoring
Design Goals
After conducting user research and pain points analysis, I establish design goals.


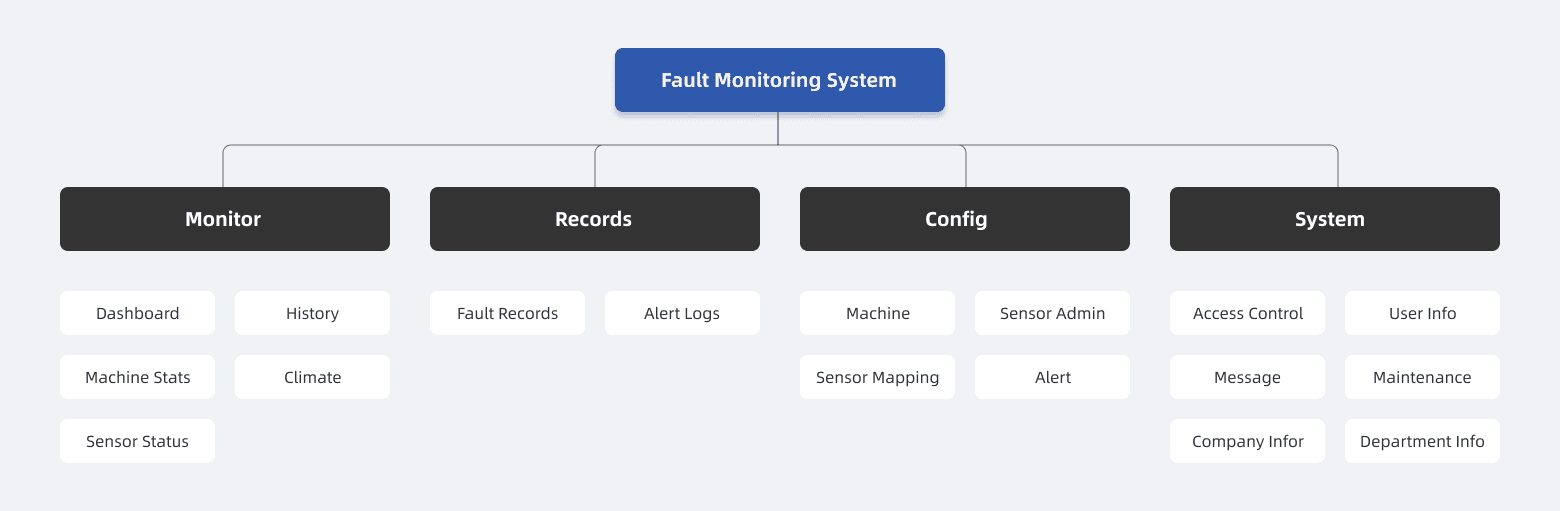
Reform the Information Architecture
According to the design goals, I reformed the system's information architecture: the system includes features such as real-time and historical monitoring dashboards for equipment, automated real-time alerts, monitoring data statistics, artificial intelligence analysis, and data visualization reports.
Design Solution
The design solutions are structured around the three phases of the monitoring process: Pre-Monitoring, During Monitoring, and Post-Monitoring. For each phase, key user needs and pain points are identified, followed by showcasing the corresponding design solutions.
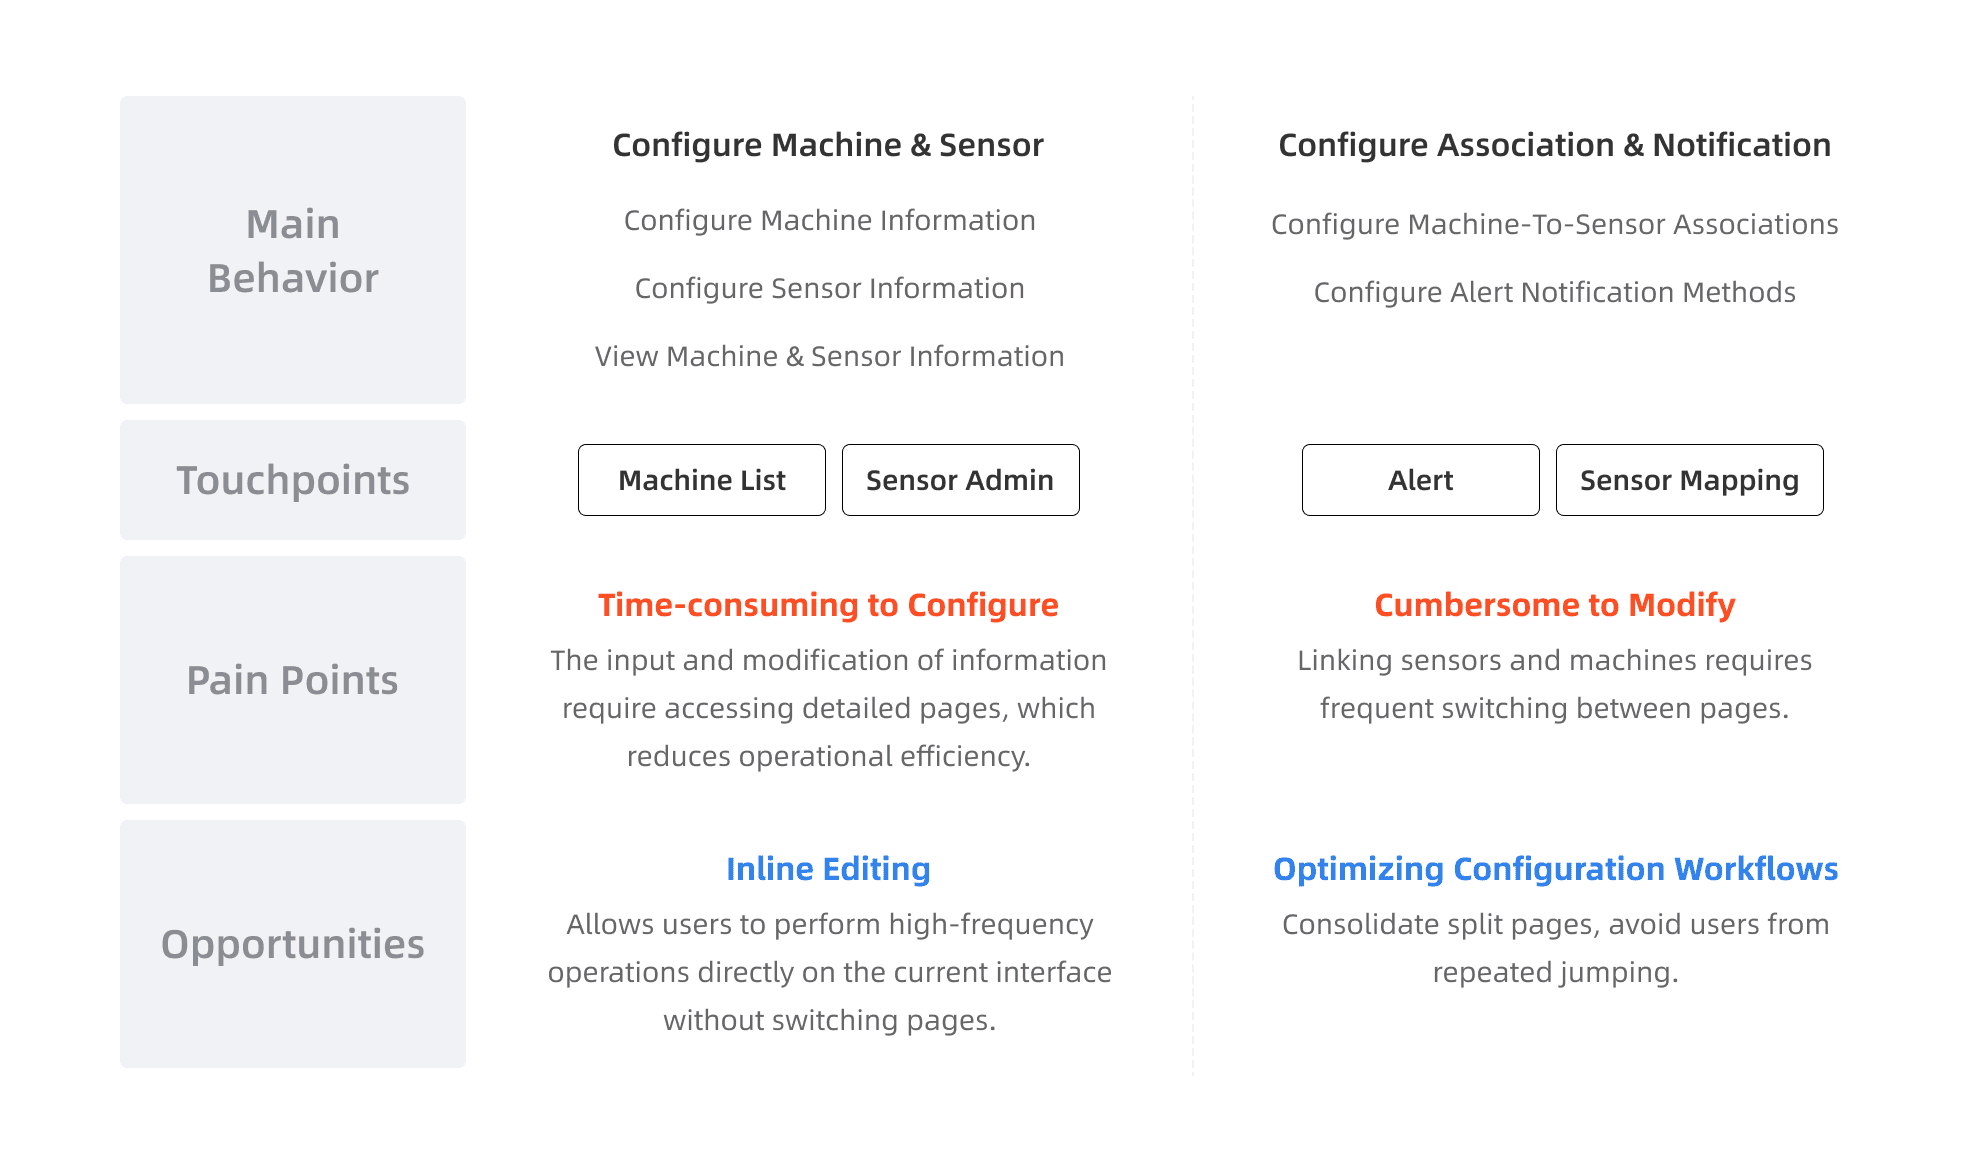
Pre-Monitoring Stage
User requirement 1 - Batch linking of sensors and machines
Machines require various sensors (e.g., sound, temperature, vibration, current), and each sensor can only be linked to one machine. Operators must assign sensors to the correct machine.
Pain point: Cumbersome to configure machine-to-sensor associations
Low efficiency: Linking sensors involves opening a pop-up and searching in a dropdown menu, which is cumbersome with a large number of sensors.
Repetitive actions: Linking multiple sensors to one device requires repeating the process multiple times.
Before: Linking N sensors to a machine required at least 6*N clicks
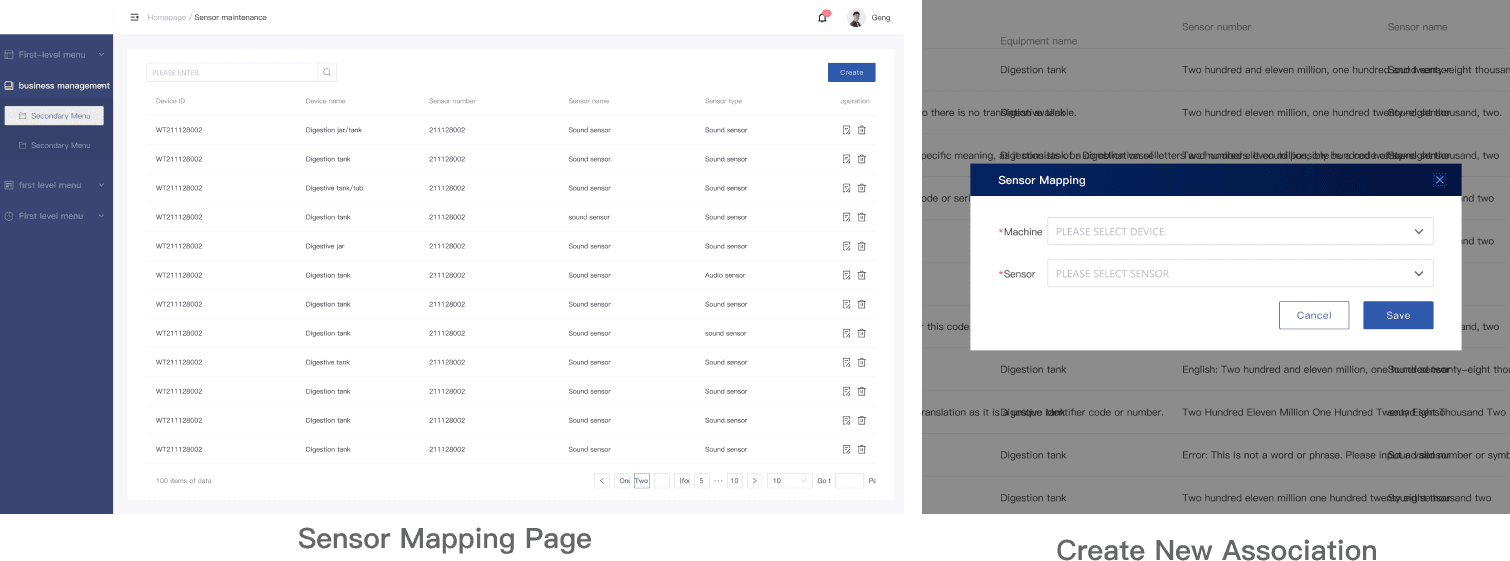
Solution: Reforming the machine-to-sensor association process

User requirement 2 - Configure and modify sensors
Pain point: Time-consuming to configure & modify
After operators configure sensors, they often need to modify settings such as activation status, deactivation, or monitoring interval. This requires opening the details page for each sensor to make changes, making the process inefficient and cumbersome.
Before: Have to click and jump into edit page to modify sensor
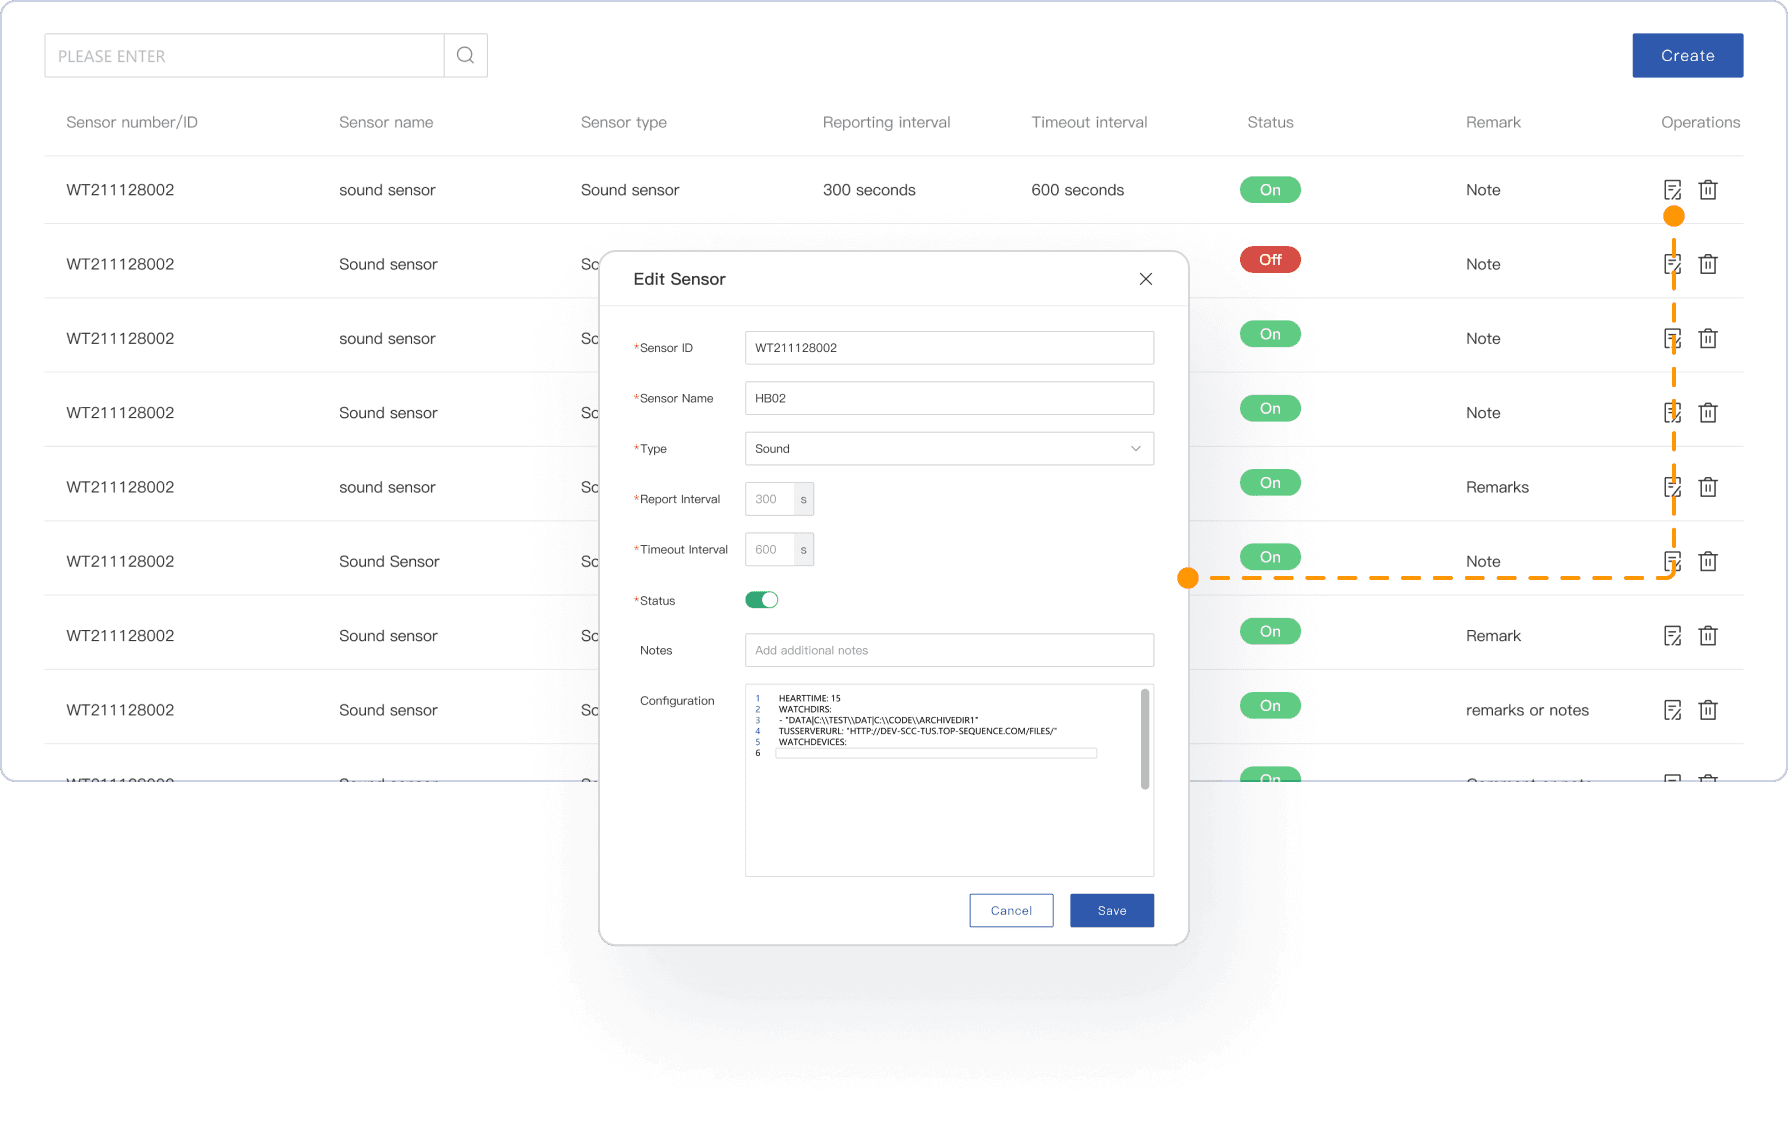
Solution: Inline and batch editing
Enables users to perform high-frequency actions, such as activating sensors or adjusting report intervals, directly on the current page. Batch editing capabilities are provided to streamline workflows and enhance efficiency.

During Monitoring Stage
User requirement 3 - View real-time machine status
According to feedback from factory operators, some machines in the factory experience more than 10 errors per day, necessitating real-time monitoring to quickly identify issues and carry out maintenance as soon as possible.
Pain point:
Interface Too Cluttered: the UI design uses excessive colors, and there is too much noise, making it difficult to read.
Low Search Efficiency: There is no search feature, making it difficult to view specific machine.
Low Screen Efficiency: Single-column waterfall layout can only display two devices within a single screen height, making it difficult to promptly identify alerted machines.
Before - Dashboard
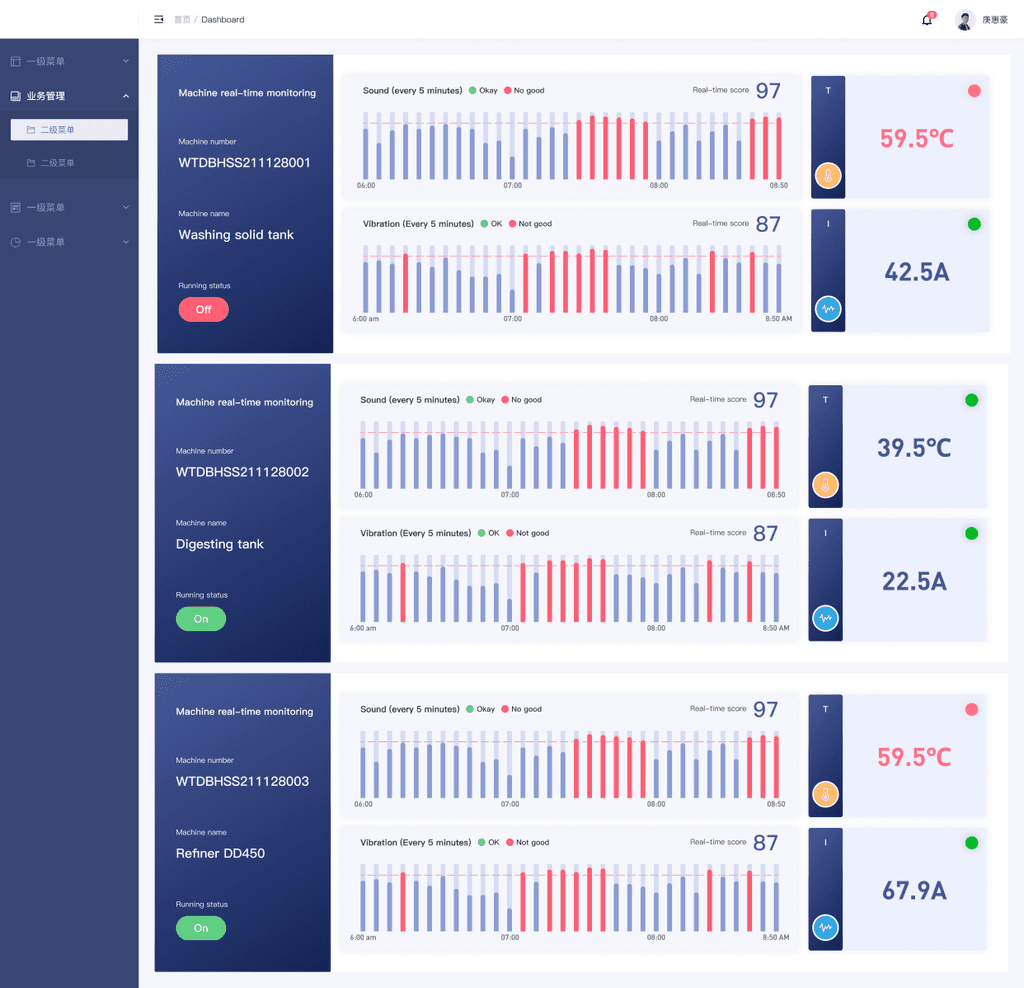
Solution: Enhance focus on alerted machines, split dashboard into overview & details pages


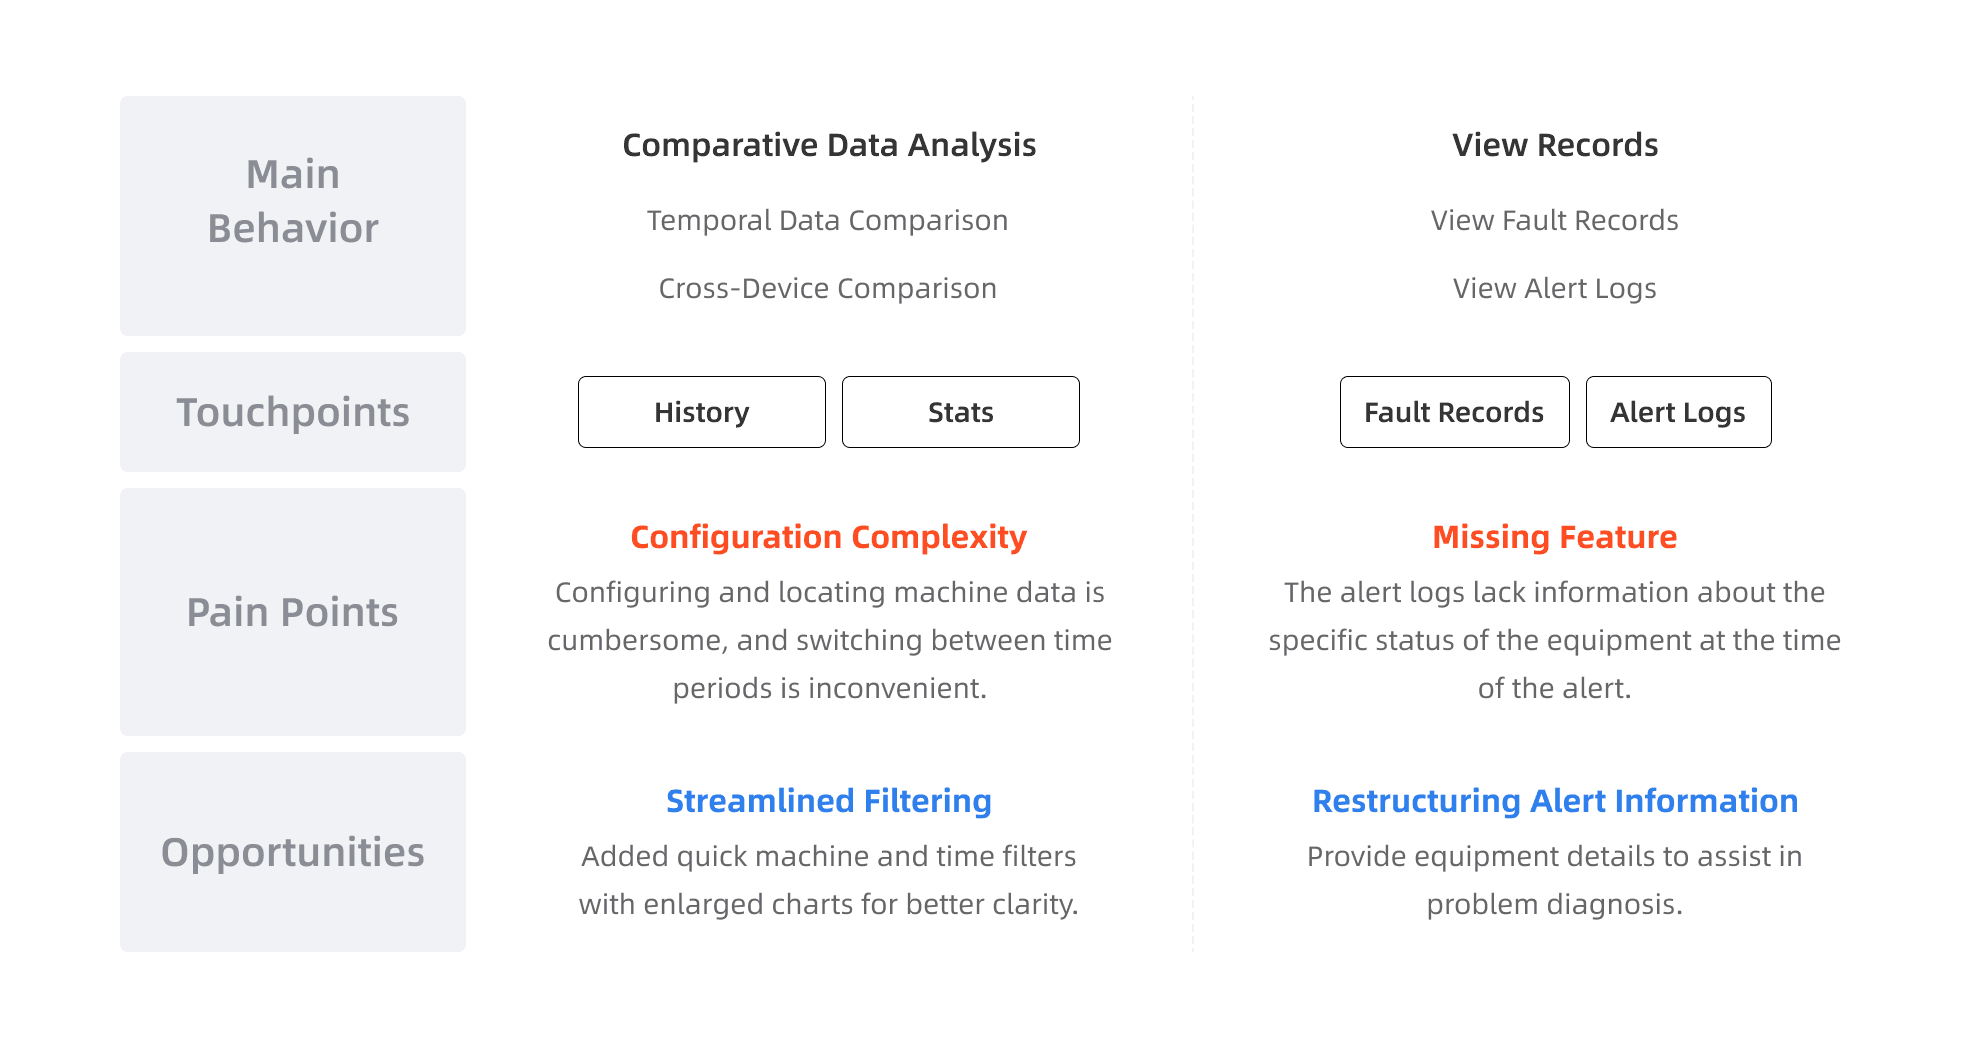
Post-Monitoring Stage
User requirement 4&5 - Temporal Data Comparison & Cross-Device Comparison
Maintenance engineers compare equipment data across time periods and devices to analyze machine health and lifespan.
Pain point: Configuration Complexity

Solution: Streamlined machine and time filtering


User requirement 6 - View Alert Records and Details
Maintenance engineers compare equipment data across time periods and devices to analyze machine health and lifespan.
Pain point: Low rate of effective information acquisition.
To meet factory maintenance engineers' requirements, additional column headers were added to provide more alert information, leading to space overcrowding, horizontal scrolling, and increased information load for all users.
Solution: Information Hierarchy
Display key information on the list page, move alert records detailed data to drawer panel, and optimize filtering with a read/unread status tab switch.

Design Overview

Reflection
Unlike B2C products, the core goal of designing B2B products is to enhance user efficiency. This requires a deep understanding of the specific workflows within an industry. Only by doing so can I create designs that truly meet those factory employees' requirements—this is what makes B2B product design interesting.
Unfortunately, by the time my internship ended, the product had not yet been fully developed, so I didn’t get the chance to conduct usability testing to validate the design. However, six months later, the founder of BestFunc unexpectedly reached out to ask if I could help to do UX/UI design for a new project. I guess I must have done a good job.